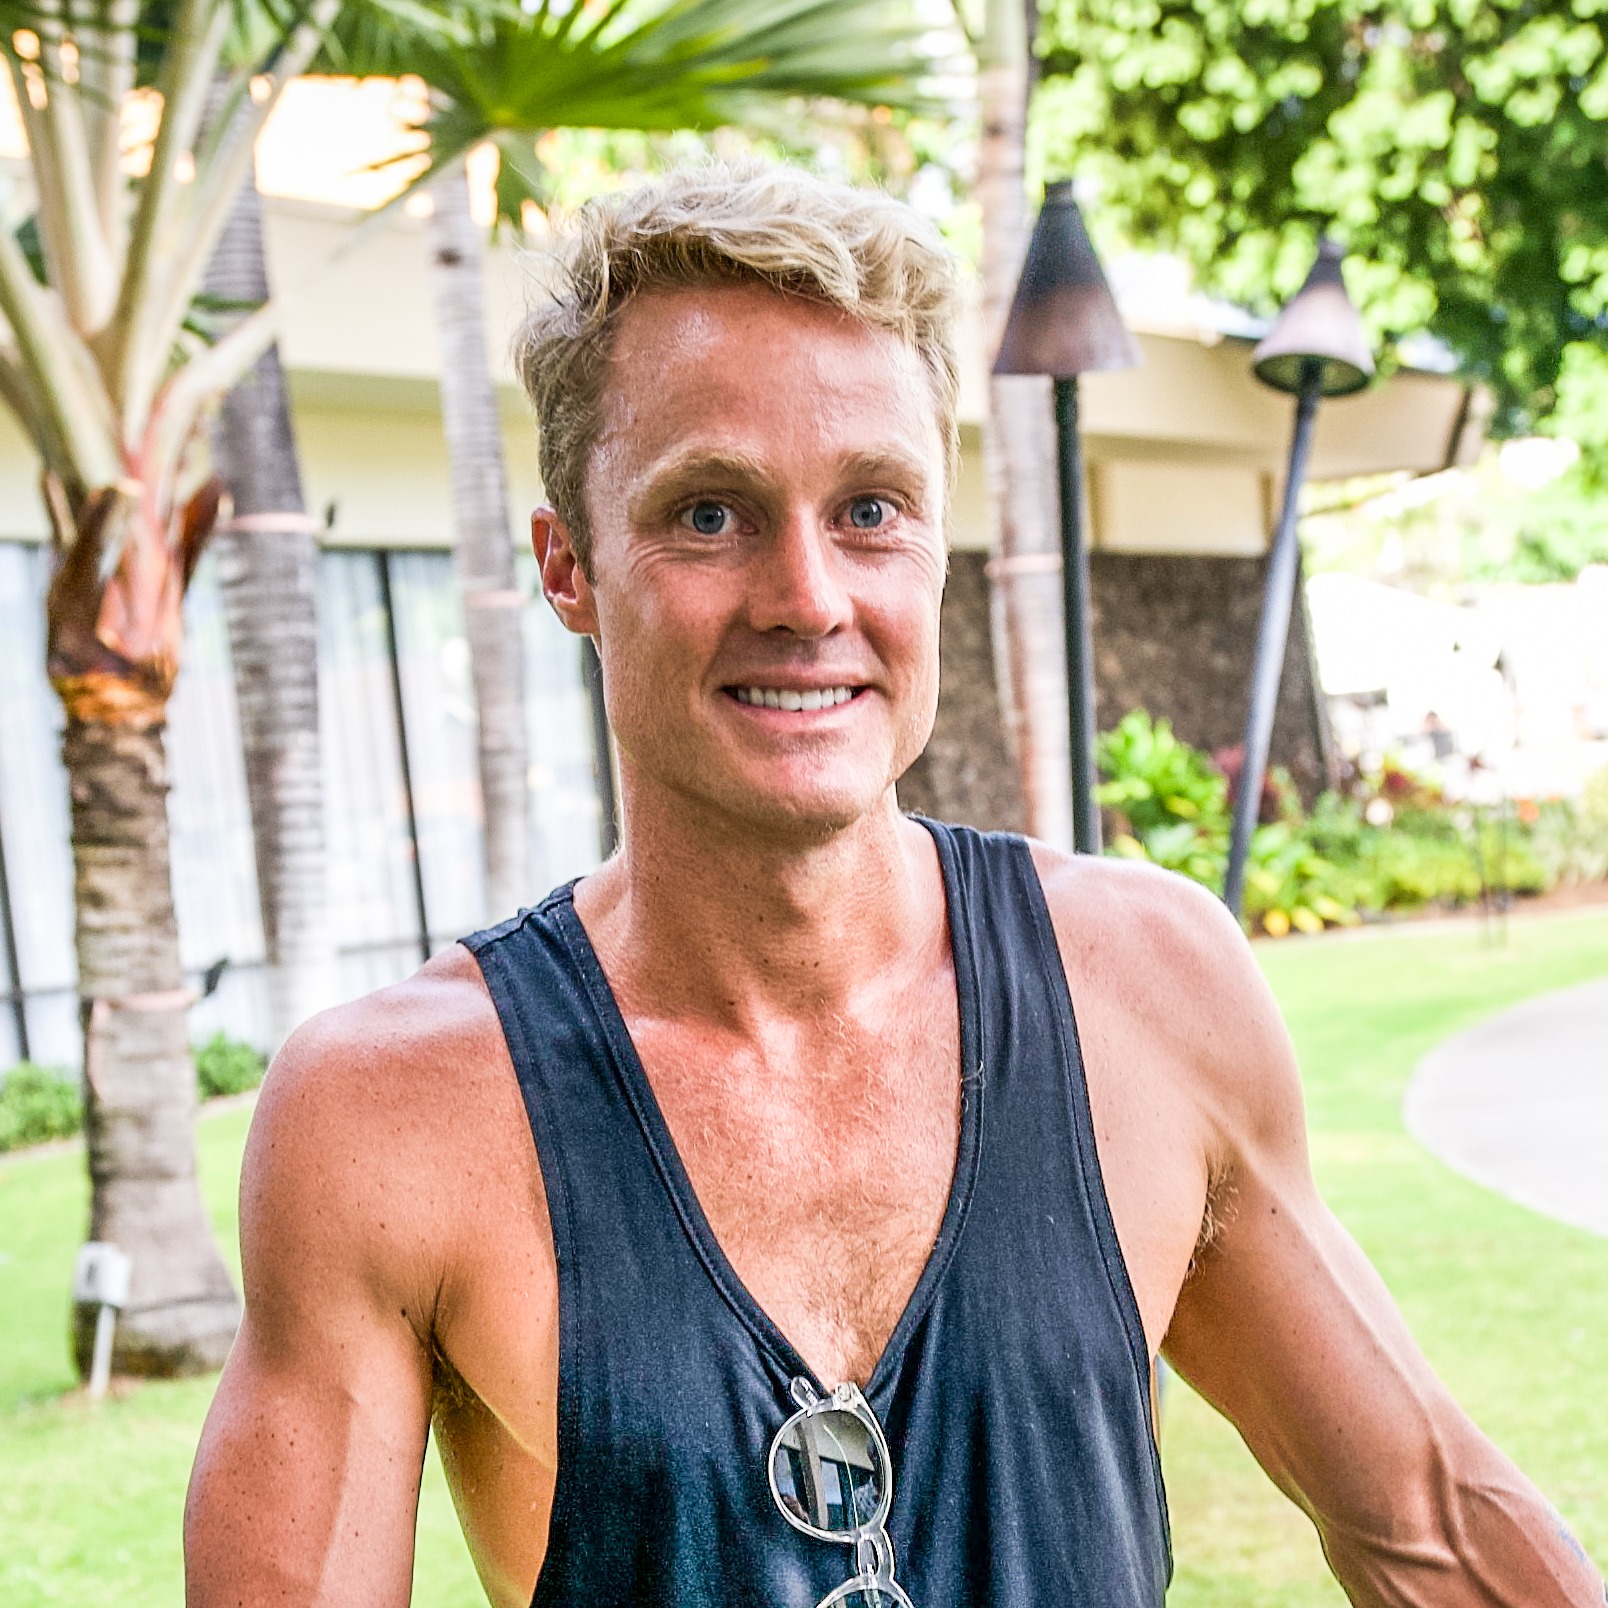
Luke Henderson
IRONMAN® Western Australia
Luke's headline numbers
Luke's strategy
Fueling
Carbohydrate is the main fuel you burn when racing. Failing to fuel properly is a leading cause of underperformance in longer races.
On the morning of the race, Luke primarily used energy drink mix to meet the minimum recommended carbohydrate dose of ~1g per kg of body weight ensuring his stores were topped up ahead of the early race start. To support glycogen sparing, he may want to consider an additional ~30g dose of carbs within 30 minutes of the swim start. On the bike, Luke effectively consumed a mix of energy gels and bars, hitting the recommended carb intake of 90g/h. His intake then dropped to ~44g/h on the run, where he relied on only four on-course gels. This meant Luke’s average intake across the race fell to ~65g/h. Luke’s ‘frontloading’ strategy on the bike will have played a part in his high energy levels. However, the ~54% reduction in carb intake from bike to run suggests an opportunity for improvement. By incorporating some gut training into his race build up, he should be able to tolerate more carbohydrate on the run, which could potentially improve his marathon performance.
Hydration
Taking on board an appropriate amount of fluid and sodium is essential to maintaining blood volume and supporting the cardiovascular effort needed to perform on race day.
Whilst the absolute amount of sodium and fluid consumed per hour is important, it’s critical to consider these in relation to each other. This is known as 'relative sodium concentration' and it’s expressed in milligrams per litre (mg/L). How much sodium you’re taking in per litre of fluid is more important than the absolute amount taken in per hour.
Sweat sodium concentration (mg/L) is largely genetically determined and remains relatively stable. Knowing how salty your sweat is enables you to replace a good proportion of your sweat losses, which can range from 200-2,000mg/L.
Given Luke’s losses are Very High (2,129mg/L), nailing his hydration strategy becomes especially crucial when it’s hot and/or humid.
Learn moreAhead of Race Day: Unfortunately, Luke has a history of ending up in the medical tent after experiencing severe bouts of cramping and hyponatremia in his first few full-distance triathlon races. Luke decided to investigate his hydration woes by collecting some data on his individual sweat losses which highlighted his extreme physiology. A Sweat Test revealed Luke loses 2,129mg of sodium per litre of sweat - which means he’s a very salty sweater - and sweat rate data collection then showed he was losing over 1.5 litres of sweat per hour (51oz/h) in 20℃ / 68°F and even up to 3L/hr (101oz/h) in >30℃ / 86°F. Luke had been following what would generally be considered a solid hydration strategy for many athletes, but given he has higher-than-average sweat sodium and fluid losses, he was only replacing a small proportion of his losses over long, hot races. After discussions with Andy and James from the PF&H team, Luke approached Western Australia with much higher fluid and sodium targets to better match his individual needs.
Race Hydration: Luke’s proactive hydration strategy started with a ~2000mg/L preload to make sure he started with a large reservoir of fluid to draw from and maximal blood volume. On the bike, he had 9 x 700ml bottles containing two PH 1500 (Tablets) each. On the run, he used flasks of PH 1500 and Electrolyte Capsules, alongside the water he picked up at most of the 24 aid stations. This meant Luke consumed an impressive ~12.5L (423oz) over the whole race. While this isn’t what we’d recommend for every athlete in similar conditions, his high sweat rate made it unlikely he would’ve been overdrinking. Similarly, Luke stuck to his very aggressive sodium intake plan to consume a relative sodium concentration of just over ~2,000mg/L across both the bike and run. This was the biggest change in Luke’s strategy, helping him keep up with his losses and avoid a large deficit building up throughout the race which he subjectively reported worked well. Perhaps most importantly, he didn’t end up in the medical tent, and had a fantastic race.
Caffeine
Beyond the Three Levers of Performance (carb, sodium and fluid), caffeine is one of only a few substances that is proven to improve performance for most endurance athletes as it can help stave off mental and physical fatigue.
Luke’s race day caffeine intake came in the form of a coffee with breakfast, two caffeine gels on the bike and a small amount of cola on the run. During the race, this ~424mg dose put him at the top end of the recommendations shown to enhance endurance performance.
How Luke hit his numbers
Here's everything that Luke ate and drank on the day...
Luke's weapons of choice
Final thoughts
Luke's full stats
Data Confidence?
There is an adequate level of accuracy in the data collected and the numbers reported. The athlete manages to recall what they ate and drank including most specifics (brands flavours quantities plausible estimations of volumes). However there are estimations made within the data which affect the overall confidence level in the data reported.