Last updated: May 2021
We've been thoroughly testing Gatorade's Gx Sweat Patch since it was launched and have shared our thoughts on its utility here.
We'll continue to update this post periodically as we use more patches and gather more data and experience with them.
Our assumption is that you probably have a decent idea of what the Gx Sweat Patch is and what it aims to achieve, if not exactly how it works. If so, you're likely here because you want to know if it's something you can use to refine your hydration strategy and improve your performance, so that's what we'll focus on, though the 'what', 'why' and 'how' is covered later in the blog if you want to dive into that.
If you've got any questions, want some help with interpreting your results, or just want to share your experiences with the patches, please do get in touch by emailing us at hello@precisionhydration.com.
Exec summary
- So far, 5 members of our team have used 25 Gx Sweat Patches during a variety of bike and run workouts, with efforts made to keep workout intensity and environmental conditions consistent in many of the tests to provide comparable results
- 4 out of 25 tests (16%) failed to provide a reliable result, which is in line with Gatorade's expected failure rate (per their published literature on development of the patch). This includes 2 patches that have failed for the same person so we have no useable data for that individual yet
- We need more data before drawing any firm conclusions, but have made some initial observations in order to help athletes decide whether to incorporate the Gx system into their hydration planning and/or better understand their results
- So far, the Gx Sweat Patch appears effective at providing 'ballpark' estimates of your sweat sodium concentration (i.e. how salty your sweat is) when compared with our Sweat Test. If this trend continues, the Gx Sweat Patch may prove to be a viable alternative option if you want to get the Sweat Test with us done, but are not in a position to visit a Sweat Test Center. NB: The Gx patches are only available to US-based athletes at present, with the app only available on iOS devices
- The sweat rate data (so far) looks less reliable, with Gatorade's patch often over-reporting sweat rates, sometimes by quite a bit. Measuring your sweat rate via pre/post workout weigh-ins still appears to be a cheaper and more reliable method at this point in time
- More testing is definitely needed to see if these trends continue
- Finally, the hydration guidance in the Gx app feels like it's weakest link so far. Collecting data on your sweat rate and sweat sodium losses is useful if it can easily be used to inform your hydration strategy. However, the in-app recommendations we've seen to this point are quite vague and cover other aspects of performance such as sleep and protein consumption alongside basic info on post-workout fluid intake. The app wraps many of these parameters (along with training data) into a single target number but, so far, it's not entirely clear what this all means, nor how it relates specifically to planning your fluid and electrolyte intake. The app is also not particularly intuitive to use so it can take a lot of time to find information you're looking for
- All that being said regarding the app; it is a BETA version at the moment so we'd anticipate many features changing and improving over time as the Gatorade team receive more feedback from users of the system
- If you've done 2+ patch tests and want help with interpreting the results, share your data with us using our Sweat Patch Help Desk form. We'll take a look at your info and give you some advice via email or on a video call.
Our test data so far
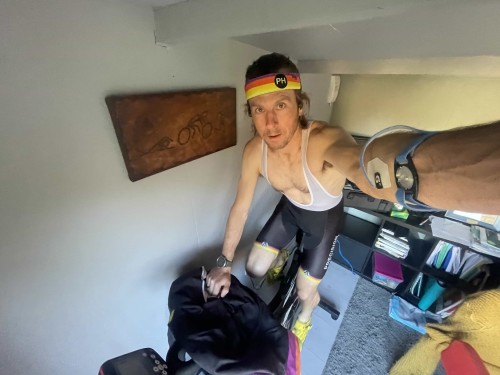
We've had the Gx patches in our hands for a few weeks now and 5 members of the team have used 25 of them during a variety of bike and run workouts.
21/25 patches have returned a usable result on the Gx app. (4/25 failed to provide a result)
Of the failures, 1 patch did not adhere to the skin properly and half peeled off during the session, so the data from that one may be questionable. 1 patch failed to scan, despite repeated attempts, so did not return any data. Air bubbles were present in the dye channel for sweat rate and sodium concentration. The other 2 failed to collect enough sweat to scan properly at all, despite total measured sweat losses of ~0.4l during indoor cycling sessions (both of these were on the same athlete during separate sessions).
Whether this failure rate of ~16% (4/25) is representative of what will happen in the future is very hard to say, but this is something we'll keep a close eye on going forward. It's worth noting that the researchers who developed the patch stated a failure rate of up to 20% in their latest paper on the patch.
It's a bit premature to dissect the limited dataset we have in detail just yet but here are some early observations.
The sweat sodium data (i.e. how salty your sweat is)
We've compared the data from the Gx Sweat Patch tests with the sweat sodium readings from our own Sweat Test, which is done at rest. This makes the collection and analysis process very controlled and simple, so the results are extremely reliable and reproducible with a low risk of 'user error' in administering the test, making them very useful as a reference point against which the Gx Sweat Patch can be tested.
Most athletes testing the Gx patches have been tested by us multiple times, with consistent results, so we're confident in using our data as a reference point. For more info on the different types of sweat testing and their merits read this post.
So, here's how the sweat sodium readings from our Sweat Test compare with the data from the Gx Sweat Patch:
Table. 1 Comparing Precision Fuel & Hydration's Sweat Test sweat sodium readings with range of mid-point readings from 2 or more Gx Sweat Patch test workouts
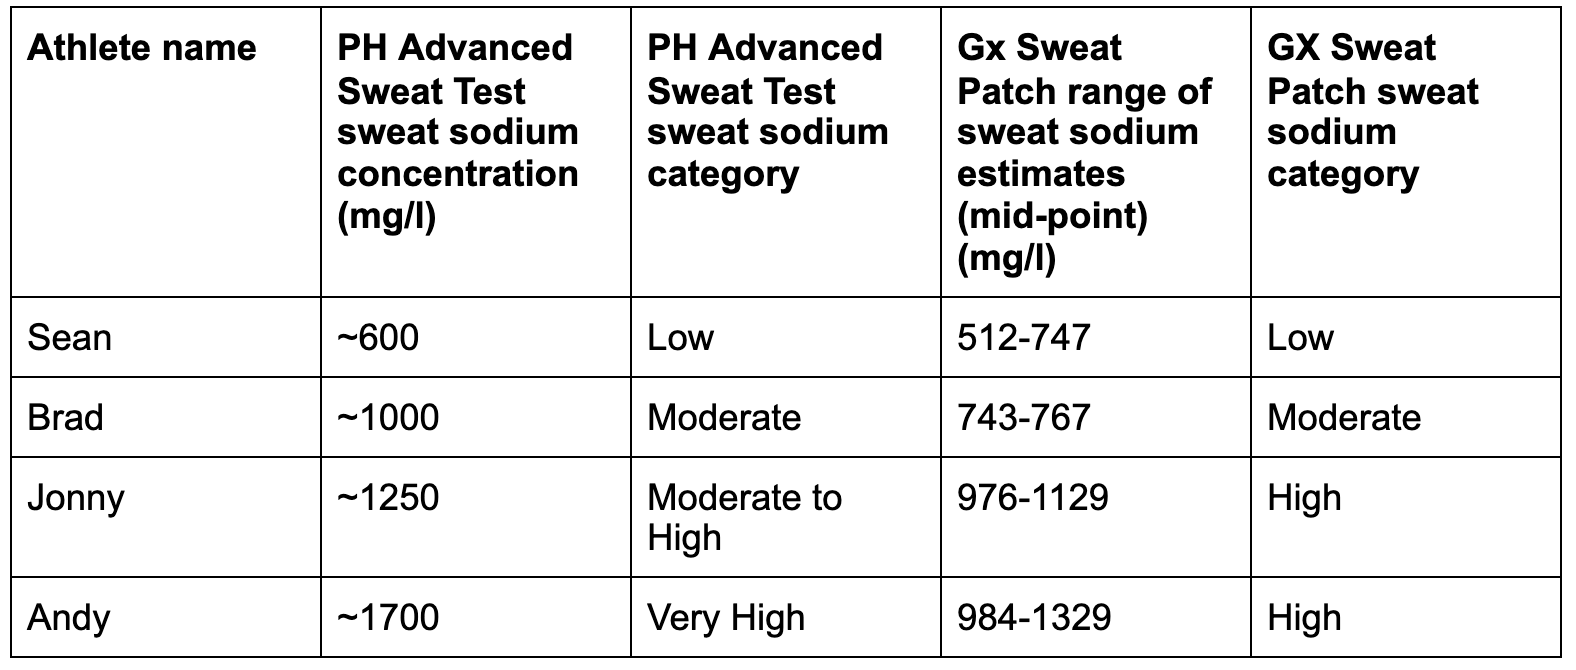
As you can see, the Gx Sweat Patch's sweat sodium readings place our athletes in the right order on the spectrum from low to high sweat sodium losses. In this sense, Gatorade's patch could be said to agree with the our Sweat Test data in the broadest sense.
All of the Gx results pitch numbers lower than the readings from our Sweat Test. This is expected as the algorithm the Gx app uses will calculate a lower sweat sodium concentration from it's colormetric reading for 'whole body sweat', because the data presented in their research papers shows that sweat from the forearm (which our test uses) is usually of a concentration slightly higher than the average of a range of sites across the whole body. (The forearm is typically used in sweat tests when only 1 body site is sampled as it offers a reasonably close correlation with total body sweat and is simple to access and apply patches or collectors to).
Based on the (admittedly small) dataset so far, it seems that the Gx Sweat Patch is doing a solid job of giving 'ballpark' estimates of your sweat sodium concentration - and in many cases a ballpark figure is all that is needed to inform sodium intake strategies for an athlete to try in training or competition.
But it is worth flagging that the ranges presented for the Gx patch do represent the mid-points of the actual ranges the app has suggested for each of the athletes.
The table below shows what the data looks like if you take the lowest possible sweat sodium reading from the Gx patch tests and contrast it with the highest in the range...
Table. 2 Comparing Precision Fuel & Hydration Sweat Test sweat sodium readings with range of extreme (end of range) readings from 2 or more Gx patch test workout.

To be clear, this is not the way the data would be analysed in a study, but it does demonstrate the wide range of interpretations possible with the way sweat sodium data is presented in the Gx app.
Although we once again see our athletes placed in the right order on the spectrum from low to high sweat sodium losses, the potential range of sweat sodium concentrations presented suddenly look much wider.
Whilst it's feasible that an individual's sweat sodium levels can vary to a small extent on a day-to-day basis, the wide variation in readings we've seen with the Gx patch so far appear to be considerably wider than what we'd have expected; and wider than in any sweat sample datasets we've seen collected and analysed via other methods during similar sessions - as well as through our own at-rest test.
That becomes a problem if you only buy one pack of Gx Sweat patches (which contain two patches). For example, Sean's data lowest sweat sodium reading was 282mg/l, with his highest being 977mg/l. That's a significant difference and one that would have a meaningful impact on his electrolyte replacement needs in a race.
Similarly, Andy's lowest data point put his sweat sodium losses at 754mg/l (low), with his highest reading being more than 2x higher at 1,616mg/l (very high). Again, this would likely impact his hydration strategy in a long, hot event.
If Sean and Andy only bought one pack and got these results, which should they trust as they attempt to refine their hydration strategy?
Of course it seems likely that, with more tests, some of the noise or outliers will get ironed out of the data and more concrete trends will occur. But, out of the gates, it looks like it could be that simply doing 1 or 2 tests with the Gx Sweat Patch may be insufficient if you want to get a truly reliable picture of how salty your sweat is. And whilst doing 4 or 5 (or more) tests obviously has the potential to improve the validity of the data it starts to push the cost up considerably.
The sweat rate data
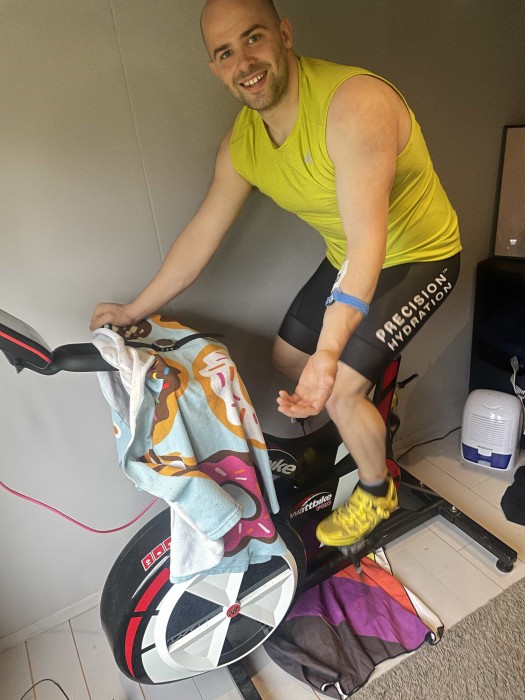
To create reference points against which we could assess the Gx Sweat Patch, we weighed ourselves before and after workouts, following the basic protocol outlined in this post on how to measure your sweat rate.
Because sweat rate is extremely variable within individuals, and heavily linked to workout intensity and environmental conditions, we tried to keep those factors relatively consistent for each person during the majority of the tests (those that we've reported data on here at least).
Here's how our measurements compare with the estimates in the Gx app...
Table. 3 Comparing sweat rates measured by pre/post weighing and sweat rate estimates from the Gx Sweat Patch.

The Gx patch seems, so far at least, to have been routinely over-estimating our sweat rates in most cases (the exception being Jonny whose readings have been closest to weigh in/weigh out results albeit still slightly on the high side).
It's worth noting that the majority of our test sessions to this point have been short (60 min or less), so any small errors in sweat rate estimates could be multiplying and this is something that may be corrected when longer sessions are undertaken. This is something we'll attempt to check with further testing.
It is also fair to state that all of the athletes who have tested the patch tend to have higher than average sweat rates so whether that is skewing the results and would be different in a more randomised population is hard to say for sure. Bringing more people into our testing pool will be necessary to test that further.
In general, it seems that the average time it took for sweat to visibly appear in the Gx patch (in the orange track) was about 20 minutes but this did vary from person to person by as much as 5-8 minutes. However, broadly it fits with the instructions stipulating at least 20 minutes of exercise in order to get a reading.
During a couple of outdoor sessions in cool weather, Andy ran with a patch for around 90 minutes and found it started to show sweat in the orange track within 25-28 minutes and then filled about 25-35% of the available track for measuring sweat rate, meaning a longer session (within the 2 hour limitation) seems very feasible without running out of track and filling the patch, which renders it unable to give a reliable sweat rate estimate.
Given that measuring your sweat rate by weighing yourself before and after exercise is neither difficult nor expensive and is likely more reliable (often still considered the 'gold standard' for fluid loss measurement in lab based testing), perhaps it should remain the serious athletes' go-to method for collecting sweat rate data anyway? Something to consider if understanding your sweat rate is the primary reason you're considering buying some Gx Sweat Patches.
The hydration recommendations in the app
Gathering sweat rate and sweat sodium data is most useful if it can be used to inform your hydration strategy and help you perform at your best.
At present, the Gx app seems to offer little in the way of concrete recommendations for how to take the sweat and sodium readings and turn them into a meaningful hydration strategy for a specific sport.
It also seems to offer tips on many aspects of performance, health, nutrition and recovery such as sleep, foam rolling, protein intake and so on.
It wraps many of these parameters along with training data into a single target number which can be toggled to either a 'Rest, Maintain, Improve or Compete' setting - presumably to push you in an appropriate way to help meet the relevant goal but, so far, it's not especially clear what this all really means, nor how it relates specifically to planning your fluid and electrolyte intake.
In fairness, we've only been using the app for a short period of time and it is a BETA release, so our opinions may change as we learn to navigate it more skillfully, but at this point the recommendations seem to be something of a weakness.
If you've conducted at least 2 patch tests and you want help with interpreting the results and using them to refine your hydration strategy, you can share your data with us using our Sweat Patch Help Desk form. We'll take a look at your info and give you some advice via email or on a free video call.
If you're looking for more background on the Gx Sweat Patch and how it works, we've got you covered...
What is the Gx Sweat Patch and what does it aim to do?
Gatorade's Gx Sweat Patch is a single-use wearable 'microfluidic' device that estimates your sweat rate (how much fluid you're losing) and how much sodium you're losing in that sweat during workouts. At the time of writing (April 2021), it costs $24.99 for a pack of 2 single use patches and is only available in the US.
The patch is designed to be worn on your left ventral (inside) forearm and requires you to exercise at an intensity sufficient enough to sweat significantly for between 20 minutes and 2 hours in order to give valid estimates of your sweat and sodium losses.
It's rated to work in a temperature range of between 47F and 95F (~8C and 35C) and can be used either indoors or outdoors and across a variety of land based sports, but does not work in the water.
The overall concept behind the patch is to enable you to better understand your total sweat and sodium losses during exercise so that you can better personalize your hydration strategy. More on why this is so important here.
Whilst there's a heated debate in the sports science world about the finer points of hydration and electrolyte replacement guidelines, it's clear that there's no 'one-size-fits-all' advice.
Athletes with higher rates of sweat and sodium loss are at greater risk of suffering problems associated with dehydration or hyponatremia (low blood sodium levels) if their hydration needs are not adequately met.
So getting a reliable estimate of your sweat and sodium losses can be very valuable in helping you get your fluid and sodium intake levels in the right 'zone' for you as an individual.
This is what we've been helping athletes do at Precision Fuel & Hydration for more than 10 years, using our own Sweat Tests, personalized hydration plans and multi-strength electrolyte supplements.
On the face of it the Gx Sweat Patch actually offers very similar data to the Sweat Test. However, one important difference is that Gatorade's patch collects sweat data during exercise rather than at rest as is the case with our method.
Arguably, both collecting sweat at rest or during exercise have their pros and cons depending on the situation you find yourself in. But both share the same fundamental aim of giving you data on your individual 'sweat signature', to help you work out what kind of levels of fluid and sodium intake you need when you undertake exercise of different durations, intensities and in varying environmental conditions.
On the whole, sweat sodium concentration is fairly stable within an individual but can vary up to 10x between people. Sweat rate is far more variable within an individual (driven by factors such as workout intensity, environmental factors and clothing as well as genetics).
How does Gatorade's patch work?
The Gx Sweat Patch only works in conjunction with the free Gx smartphone app (currently available for iOS but not Android) and, at the time of writing, the app is exclusively available to athletes based in the US.
Collecting data
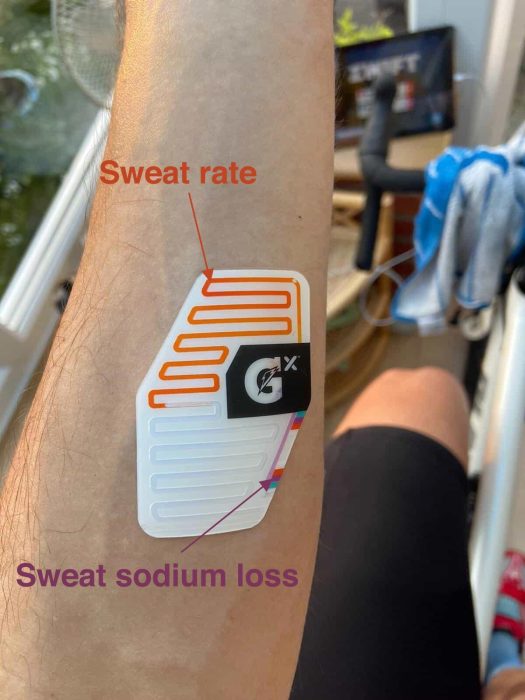
To get sweat rate and concentration readings, you 'scan' the patch with your phone's camera from within the app immediately after your workout. The image is interpreted digitally by the software, which looks at the distance the orange line has travelled along its channel to measure your sweat rate. To estimate your sweat sodium losses, the app measures the intensity of the purple color in a separate channel that runs up the side of the patch against reference colours printed on the patch's surface.
As an aside; the purple channel on the Gx sensor technically measures the level of chloride in your sweat, not sodium. It does this using colormetric analysis. Because the level of sodium in sweat is significantly correlated to the amount of chloride (salt which is dissolved in sweat is NaCl, sodium chloride) the sodium level can be inferred from the level of chloride measured.
Workout data to accompany the sweat data can be entered manually when you scan the patch or the Gx app can be synced with activity apps Apple Health, Strava and Garmin Connect in order to pull details of your session in automatically.
The app uses algorithms developed by Gatorade over the past decade or so to estimate total body sweat rate and sodium losses based on sweat collected from a small area of the forearm.
The algorithms are built on a substantial body of work published by Gatorade scientists in scientific journals going back as far as 2009, 2016, 2018, 2019 and 2020. Lindsay Baker (Senior Scientist at the Gatorade Sports Science Institute) has been the lead researcher on most of the papers that appear to have been building towards the release of the Gx patch.
For a more in-depth overview of the various papers and concepts that contributed to the development of the Gx patch and associated software see this presentation.
One important fact to make clear is that the Gx patch gives post-workout summary data of estimated total sweat and sodium losses but no real time feedback on sweat rate or sweat composition.
Viewing the data
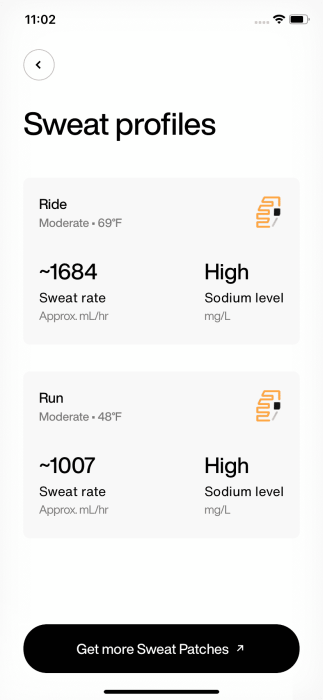
When you complete a specific workout for the first time and scan the patch, the Gx app creates a 'Sweat Profile' for that type of session (referencing the sport type, temperature, intensity and duration). This can be used to estimate sweat and sodium losses for similar sessions in the future, so that you can reference that data and get estimates of your sweat and sodium losses without wearing another patch.
When you upload future sessions with similar characteristics, the app asks whether you want to use an existing sweat profile, or create another one based on the latest data.
Having scanned a session for the first time, the output you initially see in the app is an estimate of your total sweat volume losses for the session, expressed in fluid ounces, and your sweat rate expressed in ml/hour. Your sweat rate is estimated by the software looking at the distance the orange line of sweat has moved along it's channel during the session.
The second output on the screen is an estimate of your total sweat sodium loss in milligrams and your sweat sodium concentration expressed in milligrams of sodium per liter of sweat lost.
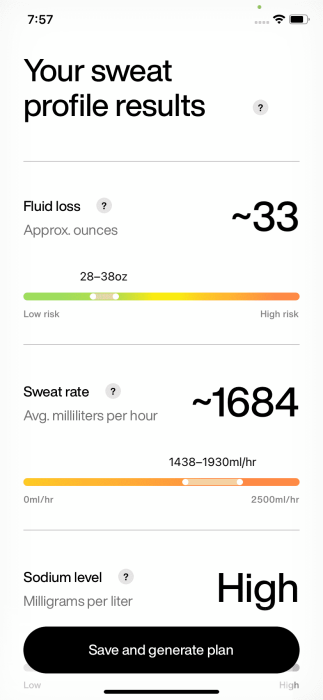
Your sweat sodium loss is also categorized as anything from 'Low' to 'Very High' and presented in terms of a range of loss rather than a single exact number. As we know from our own data and experience of sweat testing over the last decade, sweat sodium can vary dramatically (up to 10-fold) between people so is a huge driver of the inter-individual differences we see in net sweat sodium losses during longer and hotter workouts and races.
Both the sweat rate and sweat sodium estimates present a likely range of loss below a headline figure that sits at the centre of that potential range of losses. This conceptually makes sense because there's always a small degree of day to day variation in both sodium concentration in sweat and sweat rate even when all external factors are equal so the idea of expressing this as a range rather than an exact data point makes sense.
If you've got any questions, want some help with interpreting your results, or just want to share your experiences with the patches, please do get in touch by emailing us at hello@precisionhydration.com. We would love to hear your thoughts and experiences using this new piece of technology.
